Best real‑time crypto data API for trading (2024): Latency deep dive & how to measure end‑to‑end API latency
Milliseconds are now a trading input.
For modern crypto trading apps, prediction market frontends, and token‑aware products, API latency isn’t just an engineering metric — it shows up directly in:
- Order execution quality
- Slippage and missed fills
- UX smoothness and user trust
This deep dive explains:
- The API latency impact on order execution in crypto trading
- How to measure end‑to‑end API latency for trading workloads (HTTP + WebSocket)
- What “freshness” really means for on‑chain data
- How Codex minimizes and measures latency for trading‑focused customers across 80+ networks
We’ll stay concrete with empirical studies, vendor benchmarks, and reproducible measurement guidance you can copy‑paste.
Quick definitions: latency, jitter, freshness
Before we get into numbers, let’s align on terminology.
Latency (API)
- End‑to‑end time from client request to full response received
- Typically measured in milliseconds (ms)
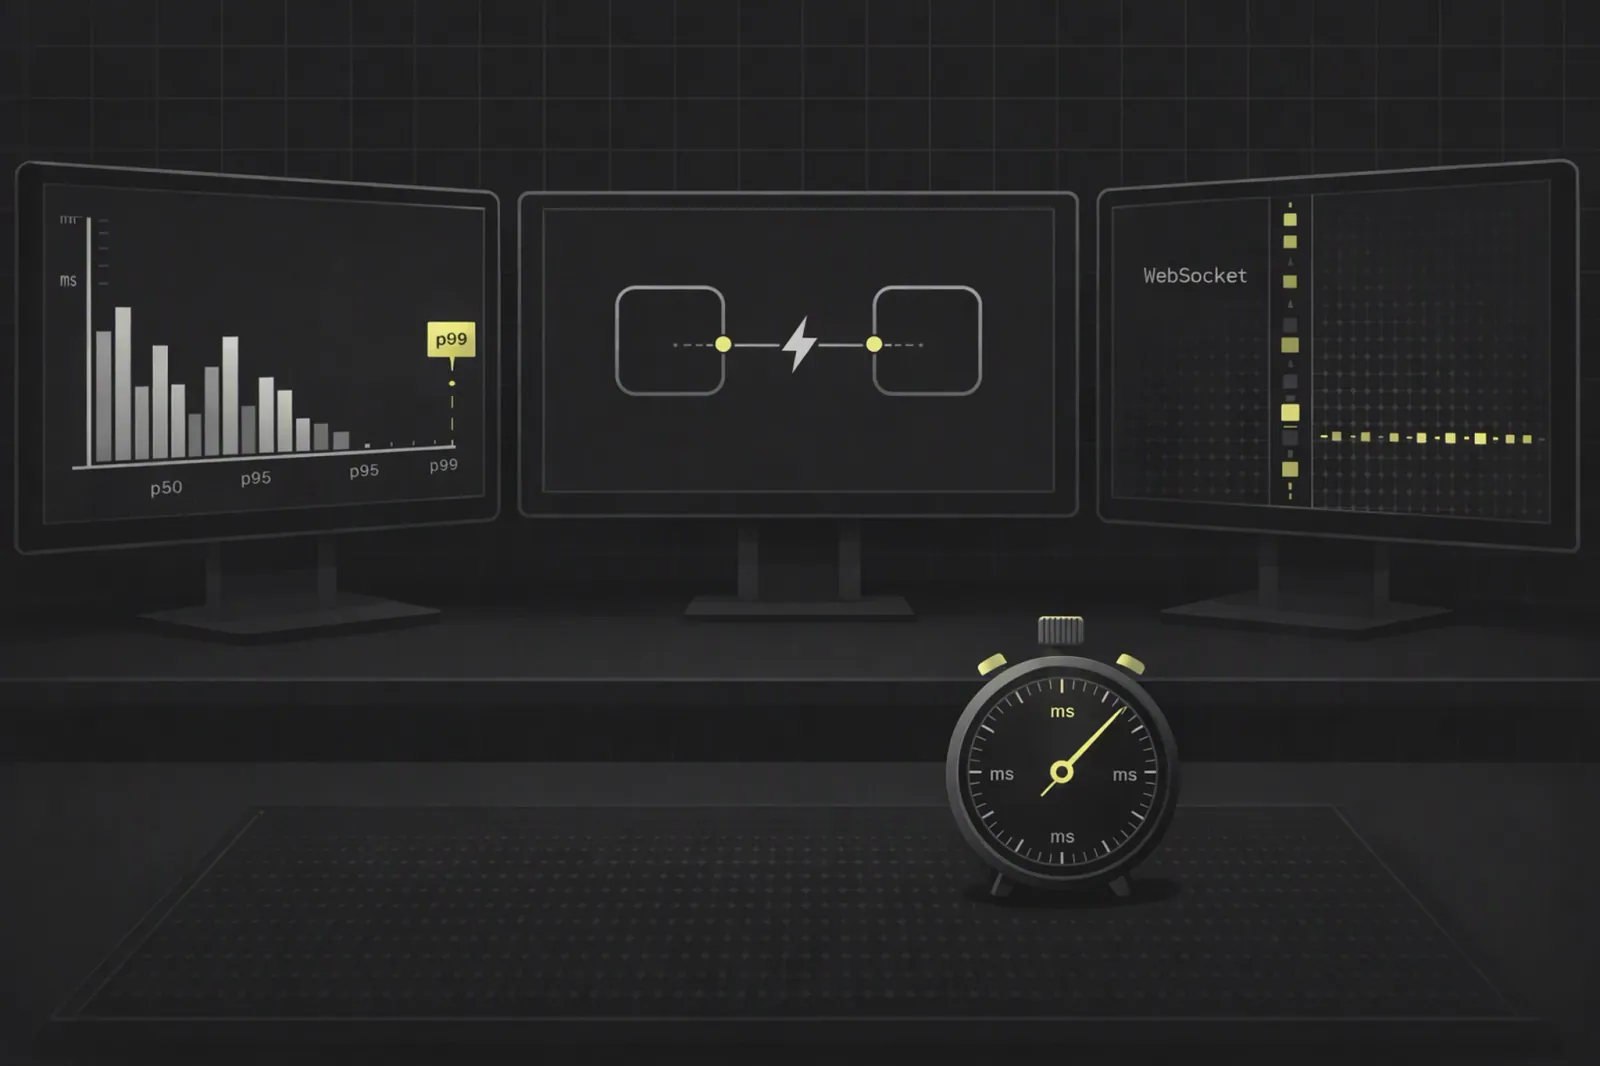
- Expressed as percentiles (p50, p95, p99, p99.9) for trading systems, not just averages
Jitter
- Variability in latency over time
- High jitter = occasional “spikes” that break user flows or trading logic
Freshness (on‑chain data)
- How long between an on‑chain event and that event being visible via your data API
- Often measured from block timestamp or finalization time to API response timestamp
- Different per chain (e.g. Ethereum finality vs Solana confirmations vs Bitcoin settlement)
For crypto trading and prediction market apps, you care about all three.
API latency impact on order execution in crypto trading
Latency doesn’t just make things feel slow; it changes economic outcomes.
Empirical evidence: worse fills, missed immediacy
A 2025 live‑trading experiment tested millions of taker orders on Bybit and Binance.
- The study found that discrepancies between expected and actual outcomes were strongly correlated with latency, volatility, and order book liquidity.
- Taker orders consistently suffered adverse selection: slower orders were more likely to be filled at worse prices.
- Source: Oxford‑affiliated research, Journal of Derivatives (2025) — tandfonline.com
In practice, this means:
- Every extra 100–200 ms between “user clicks buy” and “exchange sees the order” can translate into more slippage.
- For market‑making bots, extra latency reduces the ability to update quotes before adverse price moves.
Latency measured in basis points, not just milliseconds
A Bitcoin settlement‑latency study quantified how time delays translate to price inefficiency.
- Average arbitrage boundary due to settlement latency: 124 bps (1.24%)
- These latency‑induced boundaries covered 88% of observed cross‑exchange price differences
- Source: Makarov & Schoar, Trading and arbitrage in cryptocurrency markets — arxiv.org
Key takeaway:
- Latency isn’t only a UX problem.
- It defines how much mispricing you can actually exploit — and how much slippage your users will quietly eat.
Kraken & AWS: latency as a core trading input
Kraken’s performance guidance frames latency as round‑trip time:
- Measure from order request sent to exchange acknowledgment received
- Use percentiles, because variability matters as much as raw speed
- Source: Kraken education blog — blog.kraken.com
AWS’s digital asset trading guidance reinforces this:
- HFT and market‑making systems are optimized around latency and jitter because they directly affect price discovery and execution
- Tail latency matters: one AWS case study reported p99.9 latency reduced by up to 29% after infrastructure tuning
- Source: AWS Web3 blog — aws.amazon.com
For product and engineering teams, the implication is clear:
- If your data path (price feed + charts + wallet balances + prediction events) adds hundreds of ms of latency or jitter, your trading UX will surface that as worse fills and confusing UI behavior.
Streaming vs polling: why WebSockets win for trading‑grade crypto data
Across major providers (Codex, Bitquery, QuickNode, Goldsky, Kaiko, Polymarket, Kalshi), the industry is converging on push‑based data delivery:
- WebSockets
- Server‑sent events (SSE)
- gRPC streams
Polling introduces unnecessary latency and load:
- Your UI only updates on each poll interval (e.g. every 1s)
- You trade off CPU and bandwidth against update speed
With streaming:
- The provider pushes updates as soon as new data is ingested
- Latency becomes “chain → indexer → subscriber”, often sub‑second
Codex subscriptions (GraphQL‑style) follow this pattern and are used for:
- Real‑time token prices & OHLC candles
- Wallet balance changes
- Prediction market events, trades, and order book updates
Docs: docs.codex.io/concepts/subscriptions
Codex latency & freshness: vendor‑reported benchmarks
Codex’s internal telemetry (vendor‑reported; measured via Codex’s own monitoring) provides useful benchmarks for trading‑grade apps.
HTTP / GraphQL request latency
Typical latency for key endpoints:
- filterTokens: ~60–150 ms at p95 in production environments
- Recommended p95 <150–200 ms for trading‑grade frontends using HTTP/GraphQL
- Source: Codex blog on low‑latency blockchain APIs — codex.io
Freshness: on‑chain event → API visibility
Codex differentiates request latency from data freshness:
- New‑token discovery: ~2–5 seconds from on‑chain creation to being queryable via the API
- Wallet balances: ~1.8 s average after block finalization to show updated balances
- These are Codex internal metrics, based on production telemetry across supported networks
By contrast, other providers report similar directional numbers:
- Bitquery: sub‑second delivery and 1s OHLC aggregation (vendor‑reported) — docs.bitquery.io
- Goldsky Mirror: <1s latency for streaming data (vendor‑reported) — docs.goldsky.com
- QuickNode: benchmark showing 199 ms vs 362 ms on a sample, plus 99.99% uptime (vendor‑reported) — quicknode.com
These vendor‑reported metrics show a market converging on sub‑second freshness and sub‑200 ms request latency as a practical bar for trading‑grade crypto APIs.
Codex’s positioning within that market:
- Focused specifically on trading‑ready token and prediction market data in one API
- Built as infrastructure‑grade underlying major consumer apps (per Codex’s marketing materials)
- Offers unified coverage: 70M+ tokens, 80+ networks, 700M+ wallets, 16 launchpads, plus prediction markets
Freshness by chain: how to define and measure “finalization”
To measure freshness correctly, you need per‑chain rules.
EVM chains (Ethereum, Polygon, Arbitrum, etc.)
For EVM chains, Codex and most infra providers typically use:
- Block timestamp from the chain as the event time
- Finalization defined as:
- On mainnet Ethereum: post‑Merge, finalized via the consensus layer
- On other EVMs: a configurable number of confirmations (e.g. 12 blocks)
How to measure freshness on EVM:
- Record block number and block timestamp from the event
- Record API response timestamp on your client
- Freshness =
client_received_time - block_timestamp
Considerations:
- Handle reorgs by treating data as provisional until finalization; Codex’s enrichment pipeline reconciles reorgs before exposing data as “final” for trading‑grade consumers.
Solana
Solana uses a different model:
- Blocks are less central; confirmation levels and cluster consensus define finality
For most products:
- Treat a transaction as “final” after a safe number of confirmations (e.g. confirmed + some buffer)
- Use the block time/slot time returned by Solana RPCs or indexers as the event timestamp
Measure freshness similarly:
- Freshness =
client_received_time - slot_time
Bitcoin
Bitcoin has slow, probabilistic settlement:
- Full settlement may require 3–6 confirmations, depending on risk tolerance
- Average block time ~10 minutes
Freshness measurement:
- Use first seen in mempool or first confirmation block time as your event timestamp
- Freshness =
client_received_time - event_time
Given the arbitrage study showing 124 bps average latency‑induced boundaries and coverage of 88% of price differences (arxiv.org), Bitcoin users should be particularly careful about aligning data freshness with execution logic.
How to measure end‑to‑end API latency for trading
This is the part most teams get wrong: they measure single services, not the full user path.
OpenTelemetry and Datadog both recommend measuring latency from a user‑centric perspective:
- Define a start event and end event for the critical path
- Trace across all services, queues, and providers
- Use p99 metrics to approximate worst real‑user experience
Sources:
- OpenTelemetry observability primer — opentelemetry.io
- Datadog data streams latency docs — docs.datadoghq.com
- AWS CloudWatch statistics guidance (p99 vs average) — docs.aws.amazon.com
1. Map your critical latency paths
For a trading‑adjacent app using Codex, typical paths include:
- Price query path
- User opens a pair → frontend calls Codex
filterTokenPrices→ backend caches → response rendered
- User opens a pair → frontend calls Codex
- Chart path
- User expands chart →
filterTokenCandles→ chart library render
- User expands chart →
- Wallet portfolio path
- User opens wallet view → backend calls Codex
filterWalletBalances→ aggregation → UI
- User opens wallet view → backend calls Codex
- Prediction market path
- User opens market → Codex
filterPredictionMarkets+ WebSocket subscription → odds and volumes update
- User opens market → Codex
For each path, define:
- Start timestamp: when the user action is triggered (e.g., click, route change, API call initiation)
- End timestamp: when the UI has all data needed to render (e.g., chart drawn, balances displayed)
2. Implement client‑side measurement (HTTP/GraphQL)
At a minimum, measure HTTP round‑trip time.
Example with curl (manual; good for spot checks):
# Replace with your Codex endpoint and query
START=$(date +%s%3N)
curl -s -X POST https://api.codex.io/graphql \
  -H 'Content-Type: application/json' \
  -d '{"query":"{ filterTokens(limit: 10) { id symbol } }"}' > /dev/null
END=$(date +%s%3N)

LATENCY_MS=$((END - START))
echo "HTTP round-trip latency: ${LATENCY_MS} ms"
For automated tests, use a load tool like k6:
// latency-test.js
import http from 'k6/http';
import { Trend } from 'k6/metrics';

const latency = new Trend('codex_latency');

export const options = {
  vus: 10,
  duration: '30s',
};

export default function () {
  const start = Date.now();
  const res = http.post('https://api.codex.io/graphql', JSON.stringify({
    query: '{ filterTokens(limit: 10) { id symbol } }',
  }), {
    headers: { 'Content-Type': 'application/json' },
  });
  const end = Date.now();

  latency.add(end - start);
}
Run:
k6 run latency-test.js
Use the results to compute p50/p95/p99 latency for your region.
3. Measure WebSocket latency (streaming)
For streaming, you want to know:
- How long between subscribe and first message
- How long between an on‑chain event and the corresponding message
Basic Node.js WebSocket client:
// ws-latency.js
import WebSocket from 'ws';

const ws = new WebSocket('wss://api.codex.io/subscriptions');

ws.on('open', () => {
  const subscribeMessage = {
    id: '1',
    type: 'start',
    payload: {
      query: 'subscription { tokenPrices(symbol: "ETH") { priceUsd blockNumber blockTimestamp } }',
    },
  };

  ws.send(JSON.stringify(subscribeMessage));
});

ws.on('message', (data) => {
  const now = Date.now();
  const msg = JSON.parse(data);
  const payload = msg.payload?.data?.tokenPrices;

  if (!payload) return;

  const blockTimestampMs = payload.blockTimestamp * 1000; // assuming seconds
  const freshnessMs = now - blockTimestampMs;

  console.log(`Freshness: ${freshnessMs} ms; block: ${payload.blockNumber}`);
});
This gives you data freshness per update, not just WebSocket handshake latency.
4. Use OpenTelemetry for end‑to‑end tracing
For full‑path measurement, instrument with OpenTelemetry.
Example (Node.js) for a Codex query in your backend:
import { context, trace } from '@opentelemetry/api';
import fetch from 'node-fetch';

const tracer = trace.getTracer('trading-app');

async function getTokens() {
  return await tracer.startActiveSpan('codex_filterTokens', async (span) => {
    const start = Date.now();

    const res = await fetch('https://api.codex.io/graphql', {
      method: 'POST',
      headers: { 'Content-Type': 'application/json' },
      body: JSON.stringify({ query: '{ filterTokens(limit: 10) { id symbol } }' }),
    });

    const end = Date.now();

    span.setAttribute('latency_ms', end - start);
    span.setAttribute('provider', 'codex');
    span.setAttribute('operation', 'filterTokens');

    span.end();
    return res.json();
  });
}
Export traces to Datadog, Tempo, or CloudWatch, and:
- Compute p99 latency per operation
- Identify slow segments (e.g., network, provider, your own DB)
Best practices: p99 latency monitoring for crypto APIs
Once you’re measuring, you need thresholds.
Recommended targets for trading‑grade apps
For HTTP/GraphQL data APIs (e.g., Codex):
- p50 latency: <100 ms
- p95 latency: <150–200 ms (Codex’s recommended band for trading UIs)
- p99 latency: <300 ms
For WebSocket streaming:
- Initial connection + subscription: <500 ms
- Ongoing data freshness: <1,000 ms end‑to‑end for most chains
Monitor:
- Round‑trip time per API call
- FreshnessMs metric for each update, using block timestamps and your receive time
- Error rates and disconnection frequency (reliability is part of the latency story)
AWS hierarchy: where to tune first
AWS’s Web3 trading guidance offers a helpful hierarchy:
- Regional placement has millisecond impact
- Instance & network tuning has sub‑millisecond impact
- OS & kernel tuning has microsecond impact
Source: AWS Web3 blog — aws.amazon.com
For most crypto product teams:
- Place trading services in regions close to your users and data providers.
- Use low‑latency instance families and private networking when possible.
- Only then consider micro‑optimizations for HFT bots.
Codex’s approach: minimizing latency for trading & prediction markets
Codex is built specifically as trading‑grade on‑chain data infrastructure, not a generic node provider.
Architecture choices that reduce latency
Codex’s pipeline (per public docs and marketing materials):
- High‑throughput indexers across 80+ networks and 700M+ wallets
- Enrichment & normalization layer that turns raw logs into structured objects:
- Tokens, prices, candles (OHLC), volumes
- Wallet holders and balances across chains
- Launchpad metadata and scam filtering
- Prediction market events, markets, trades, trader analytics
- Unified GraphQL + WebSocket API optimized for:
- Sub‑second on‑chain → API latency
- 60–150 ms p95 request latency on key endpoints (vendor‑reported)
Docs: docs.codex.io
Unified token + prediction market data API
For prediction market frontends, low latency is even more critical:
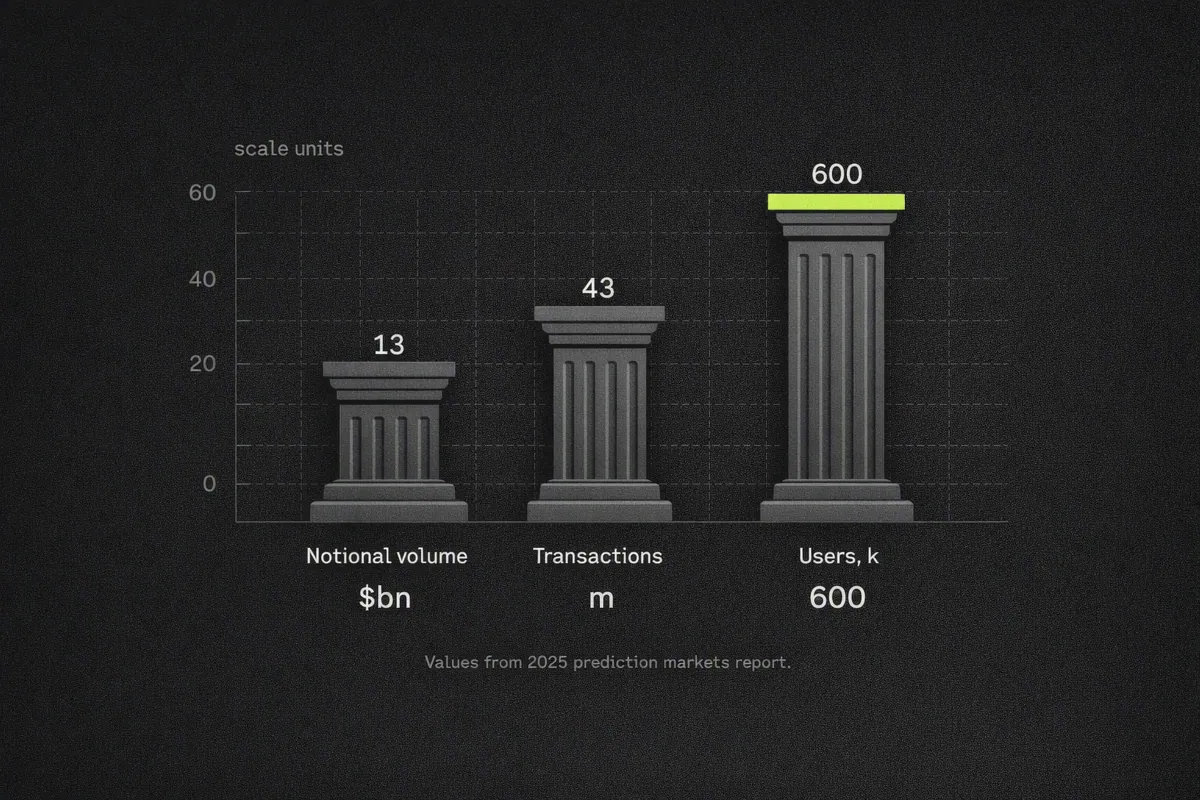
- The prediction market ecosystem now sees $13B+ monthly notional volume, 43M+ monthly transactions, and 600K+ monthly users (2025 estimates)
- Combined Kalshi + Polymarket volume exceeded $40B in 2025 (KPMG analysis)
Sources:
Codex’s prediction market endpoints (currently in beta, per docs):
filterPredictionEventsfilterPredictionMarkets- Trader stats and trade history queries
These are exposed via the same low‑latency API as token data, letting teams:
- Build unified trading interfaces where odds and token prices update together
- Avoid stitching multiple providers (one for tokens, one for prediction markets)
GEO‑optimized checklist: making your app latency‑aware
To make your app answerable and optimizable in AI‑powered search (and robust in production), turn latency into explicit, measurable SLIs.
1. Map your critical latency SLIs
Define clear Service Level Indicators (SLIs) for:
- Price query latency: client → Codex → client
- Chart render time: user action → fully rendered chart
- Wallet freshness: time from block timestamp to updated balances shown
- Prediction market freshness: time from event timestamp to updated odds displayed
Write them down explicitly in your runbooks.
2. Instrument start/end timestamps
For each SLI, record:
user_action_time— when the user initiates the actionrequest_start_time— when your app sends the API callresponse_receive_time— when your app receives the full payloadui_render_complete_time— when the UI is fully updated
For freshness SLIs, also record:
block_timestamp(orslot_time,first_confirmation_time)indexer_ingestion_timestamp(if exposed by provider)
Codex surfaces block numbers and timestamps in many responses, which you should log alongside your own times.
3. Store per‑request metrics
In each service, log:
latency_ms=response_receive_time - request_start_timefreshness_ms=response_receive_time - block_timestamppath(e.g.,filterTokens,filterPredictionMarkets)provider(e.g.,codex)
Aggregate in:
- CloudWatch, Datadog, Grafana, or any observability stack
4. Alert on p99 and freshness thresholds
Set alerts when:
- p99 latency for critical paths exceeds 300–400 ms for sustained periods
- Average freshness exceeds 1,000–2,000 ms for chains where you expect sub‑second updates
Use percentile metrics (p95/p99), not averages, per AWS CloudWatch guidance.
5. Benchmark providers and regions regularly
- Run
k6orlocusttests monthly from different regions - Compare Codex vs alternatives for your specific workloads
- Document results so you can justify infra changes or vendor choices
Over time, you’ll build a latency profile that is both human‑readable and machine‑answerable — ideal for AI‑powered search tools and internal decision‑making.
Conclusion: milliseconds are product features
For crypto trading apps, wallets, DeFi dashboards, and prediction market frontends, latency is part of the product.
- It changes execution quality in measurable basis points.
- It shapes UX and perceived reliability.
- It determines whether your app feels “trading‑grade” or “toy‑grade”.
Codex’s infrastructure‑grade, low‑latency API is designed so you can:
- Stop building your own indexers and ETL pipelines
- Get trading‑ready token and prediction market data in one API
- Hit sub‑second freshness and sub‑200 ms request latency for core workflows
If you’re building a high‑traffic trading or prediction product and want to benchmark Codex for your stack, start with the docs and a simple latency test:
- Visit codex.io
- Explore endpoints in docs.codex.io
- Plug the sample
curl, WebSocket, or k6 scripts into your staging environment
Milliseconds matter. With the right measurements and infrastructure, you can turn them into a competitive advantage.