
Building Crypto Analytics Dashboards with Codex
Meta title (for SEO): Building Crypto Analytics Dashboards with Codex: Schema Design, TVL & Volume Calculations, and Codex API Integration with Looker, Metabase, Grafana
Meta description: Learn how to use one of the best on-chain data APIs for analytics dashboards. Schema design, TVL & volume metrics, and Codex API integration with Looker, Metabase, Grafana.
If you’re building crypto analytics dashboards for trading, risk, or growth, your biggest enemy isn’t access to data — it’s consistency.
Different teams define TVL, volume, and “active users” differently. Raw on-chain logs are noisy. And stitching together multiple providers for prices, holders, and prediction markets introduces drift.
Codex solves the ingestion layer by giving you a trading‑grade blockchain data API across 80+ networks, 70M+ tokens, and 700M+ wallets, with <1s freshness and WebSockets/webhooks in a unified GraphQL API.[^codex-pricing] This guide shows you how to turn that into a clean analytics schema and production dashboards.
We’ll cover:
- Schema design for on-chain analytics tables
- Metric definitions for TVL, volume, and user counts
- Canonicalization for bridged/wrapped tokens
- How to pipe Codex into Looker, Metabase, and Grafana
- Real-time prediction market dashboards with Codex
Why choose Codex: reliability & scaling for high-traffic trading apps
If you’re evaluating the most reliable on chain data APIs for trading apps or the best crypto data APIs for high traffic trading apps, you need to know where Codex fits.
Codex is designed as infrastructure, not a side-product:
- Coverage: 80+ networks, 70M+ tokens, 700M+ wallets, and 27B+ historical events.[^codex-pricing]
- Latency & freshness: Data freshness listed as <1 second, with WebSockets and webhooks for streaming.[^codex-pricing]
- Throughput: Growth plan offers 1M requests/month and 300 req/sec, plus WebSockets and webhooks.[^codex-pricing]
- Customers: Powers Coinbase, TradingView, Uniswap, Magic Eden, Rainbow, MoonPay, and more.[^codex-home]
For analytics dashboards, that means:
- You don’t maintain custom indexers and RPC nodes.
- You get normalized prices, OHLCV, holders, and volumes out-of-the-box.
- You can scale to consumer-grade traffic without re-architecting.
You still own the warehouse, semantic layer, and dashboards — Codex becomes your single source of truth for on-chain and prediction market data.
Core schema design for blockchain analytics
You want a schema that:
- Maps cleanly to Codex’s GraphQL objects
- Is easy for dbt / BI tools to model
- Separates dimensions (tokens, wallets, markets) from facts (transfers, prices, trades)
Recommended core tables
At minimum, define:
dim_tokendim_walletfact_token_transfersfact_token_price_ohlcvfact_token_liquidityfact_prediction_tradedim_prediction_event/dim_prediction_market
Here’s an example DDL you can adapt.
-- Token dimension
CREATE TABLE dim_token (
  token_id              TEXT PRIMARY KEY,  -- Codex token ID
  chain_id              TEXT NOT NULL,
  symbol                TEXT,
  name                  TEXT,
  decimals              INT,
  canonical_token_id    TEXT,             -- mapping for bridged/wrapped tokens
  is_scam               BOOLEAN,
  safety_label          TEXT,
  launchpad             TEXT,
  first_seen_at         TIMESTAMPTZ,
  last_updated_at       TIMESTAMPTZ
);

-- Wallet dimension
CREATE TABLE dim_wallet (
  wallet_id             TEXT PRIMARY KEY, -- raw address
  cluster_id            TEXT,             -- entity-level ID (optional)
  first_seen_at         TIMESTAMPTZ,
  last_seen_at          TIMESTAMPTZ,
  is_contract           BOOLEAN,
  labels                JSONB
);

-- Token transfers (normalized ERC-20 + native)
CREATE TABLE fact_token_transfers (
  transfer_id           BIGINT GENERATED ALWAYS AS IDENTITY PRIMARY KEY,
  tx_hash               TEXT,
  block_timestamp       TIMESTAMPTZ,
  chain_id              TEXT,
  token_id              TEXT REFERENCES dim_token(token_id),
  from_wallet_id        TEXT REFERENCES dim_wallet(wallet_id),
  to_wallet_id          TEXT REFERENCES dim_wallet(wallet_id),
  amount_raw            NUMERIC,
  amount                NUMERIC,
  amount_usd            NUMERIC,
  canonical_token_id    TEXT,
  fee_usd               NUMERIC,
  event_type            TEXT              -- transfer, mint, burn, etc.
);

-- OHLCV prices
CREATE TABLE fact_token_price_ohlcv (
  token_id              TEXT REFERENCES dim_token(token_id),
  interval_start        TIMESTAMPTZ,
  interval              TEXT,             -- 1m, 5m, 1h, 1d
  open_price_usd        NUMERIC,
  high_price_usd        NUMERIC,
  low_price_usd         NUMERIC,
  close_price_usd       NUMERIC,
  volume_usd            NUMERIC,
  PRIMARY KEY (token_id, interval_start, interval)
);

-- Liquidity / pool balances
CREATE TABLE fact_token_liquidity (
  pool_id               TEXT,
  chain_id              TEXT,
  token_id              TEXT REFERENCES dim_token(token_id),
  snapshot_at           TIMESTAMPTZ,
  reserve_amount        NUMERIC,
  reserve_amount_usd    NUMERIC,
  PRIMARY KEY (pool_id, token_id, snapshot_at)
);

-- Prediction events and markets
CREATE TABLE dim_prediction_event (
  event_id              TEXT PRIMARY KEY,
  platform              TEXT,             -- Polymarket, Kalshi
  title                 TEXT,
  category              TEXT,
  start_time            TIMESTAMPTZ,
  end_time              TIMESTAMPTZ,
  status                TEXT              -- open, resolved, cancelled
);

CREATE TABLE dim_prediction_market (
  market_id             TEXT PRIMARY KEY,
  event_id              TEXT REFERENCES dim_prediction_event(event_id),
  outcome               TEXT,             -- Yes/No, specific outcome
  currency              TEXT,
  tick_size             NUMERIC,
  status                TEXT
);

CREATE TABLE fact_prediction_trade (
  trade_id              TEXT PRIMARY KEY,
  market_id             TEXT REFERENCES dim_prediction_market(market_id),
  trader_wallet_id      TEXT REFERENCES dim_wallet(wallet_id),
  executed_at           TIMESTAMPTZ,
  price                 NUMERIC,
  size                  NUMERIC,
  notional_usd          NUMERIC,
  side                  TEXT             -- buy/sell
);
This schema reflects Codex’s own primitives: tokens, prices, events, holders, trades, and prediction markets.[^codex-docs-core]
Token transfer normalization: ERC-20 vs native
A common question: how to map raw blockchain events to metrics when ERC‑20 and native token transfers have different event shapes.
Codex already normalizes transfers for you (similar to Dune’s curated transfers that cover ERC‑20 + native transfers across EVM and other chains).[^dune-transfers]
When ingesting into fact_token_transfers:
- Treat native transfers (e.g., ETH, SOL) as tokens with their own
token_id. - Use Codex’s token metadata to fill
decimals,symbol, and map tocanonical_token_id. - Store both
amount_rawandamount(human-readable), plusamount_usdwhen available.
Example dbt model (pseudo SQL) to populate facts from a staging table:
-- models/fact_token_transfers.sql
SELECT
  st.transfer_id,
  st.tx_hash,
  st.block_timestamp,
  st.chain_id,
  st.token_id,
  st.from_wallet_id,
  st.to_wallet_id,
  st.amount_raw,
  st.amount,
  st.amount_usd,
  dt.canonical_token_id,
  st.fee_usd,
  st.event_type
FROM {{ ref('stg_codex_transfers') }} st
LEFT JOIN {{ ref('dim_token') }} dt
  ON st.token_id = dt.token_id;
This approach lets you compute token-volume metrics (as DeFiLlama defines them: sum of value in all swaps to/from a token across venues)[^defi-defs] in a consistent way.
Canonicalization for bridged and wrapped tokens
To avoid double-counting, you need a canonical_token_id strategy.
Goal: group native/bridged/wrapped versions of the same asset under a single “canonical” entity when your metric requires it.
Recommended policy:
- Choose a canonical token per economic asset, e.g.
USDC.mainnet. - For wrapped or bridged instances (e.g.,
USDC.arbitrum,USDC.solana), setcanonical_token_id = 'USDC.mainnet'indim_token. - For purely synthetic tokens (e.g.,
stETH,wstETH), decide whether to:- Treat them as separate canonicals (for derivative TVL), or
- Map them to ETH canonically when you want “ETH-equivalent exposure”.
Example mapping table:
CREATE TABLE dim_canonical_token (
  canonical_token_id  TEXT PRIMARY KEY,
  symbol              TEXT,
  name                TEXT,
  reference_chain_id  TEXT
);

-- Example rows
-- ('USDC.mainnet', 'USDC', 'USD Coin Canonical', 'ethereum')
-- ('ETH.mainnet',  'ETH',  'Ethereum Native Canonical', 'ethereum')
Then populate dim_token.canonical_token_id from this mapping.
This lets you:
- Report TVL by canonical asset without double-counting cross-chain liquidity.
- Build dashboards that toggle between canonical view vs per-chain view.
How to calculate TVL from on-chain data (on-chain TVL definition: protocol vs TVL)
From DeFiLlama, protocol TVL is the value of all coins held in the smart contracts of the protocol; chain TVL sums protocol TVLs.[^defi-defs]
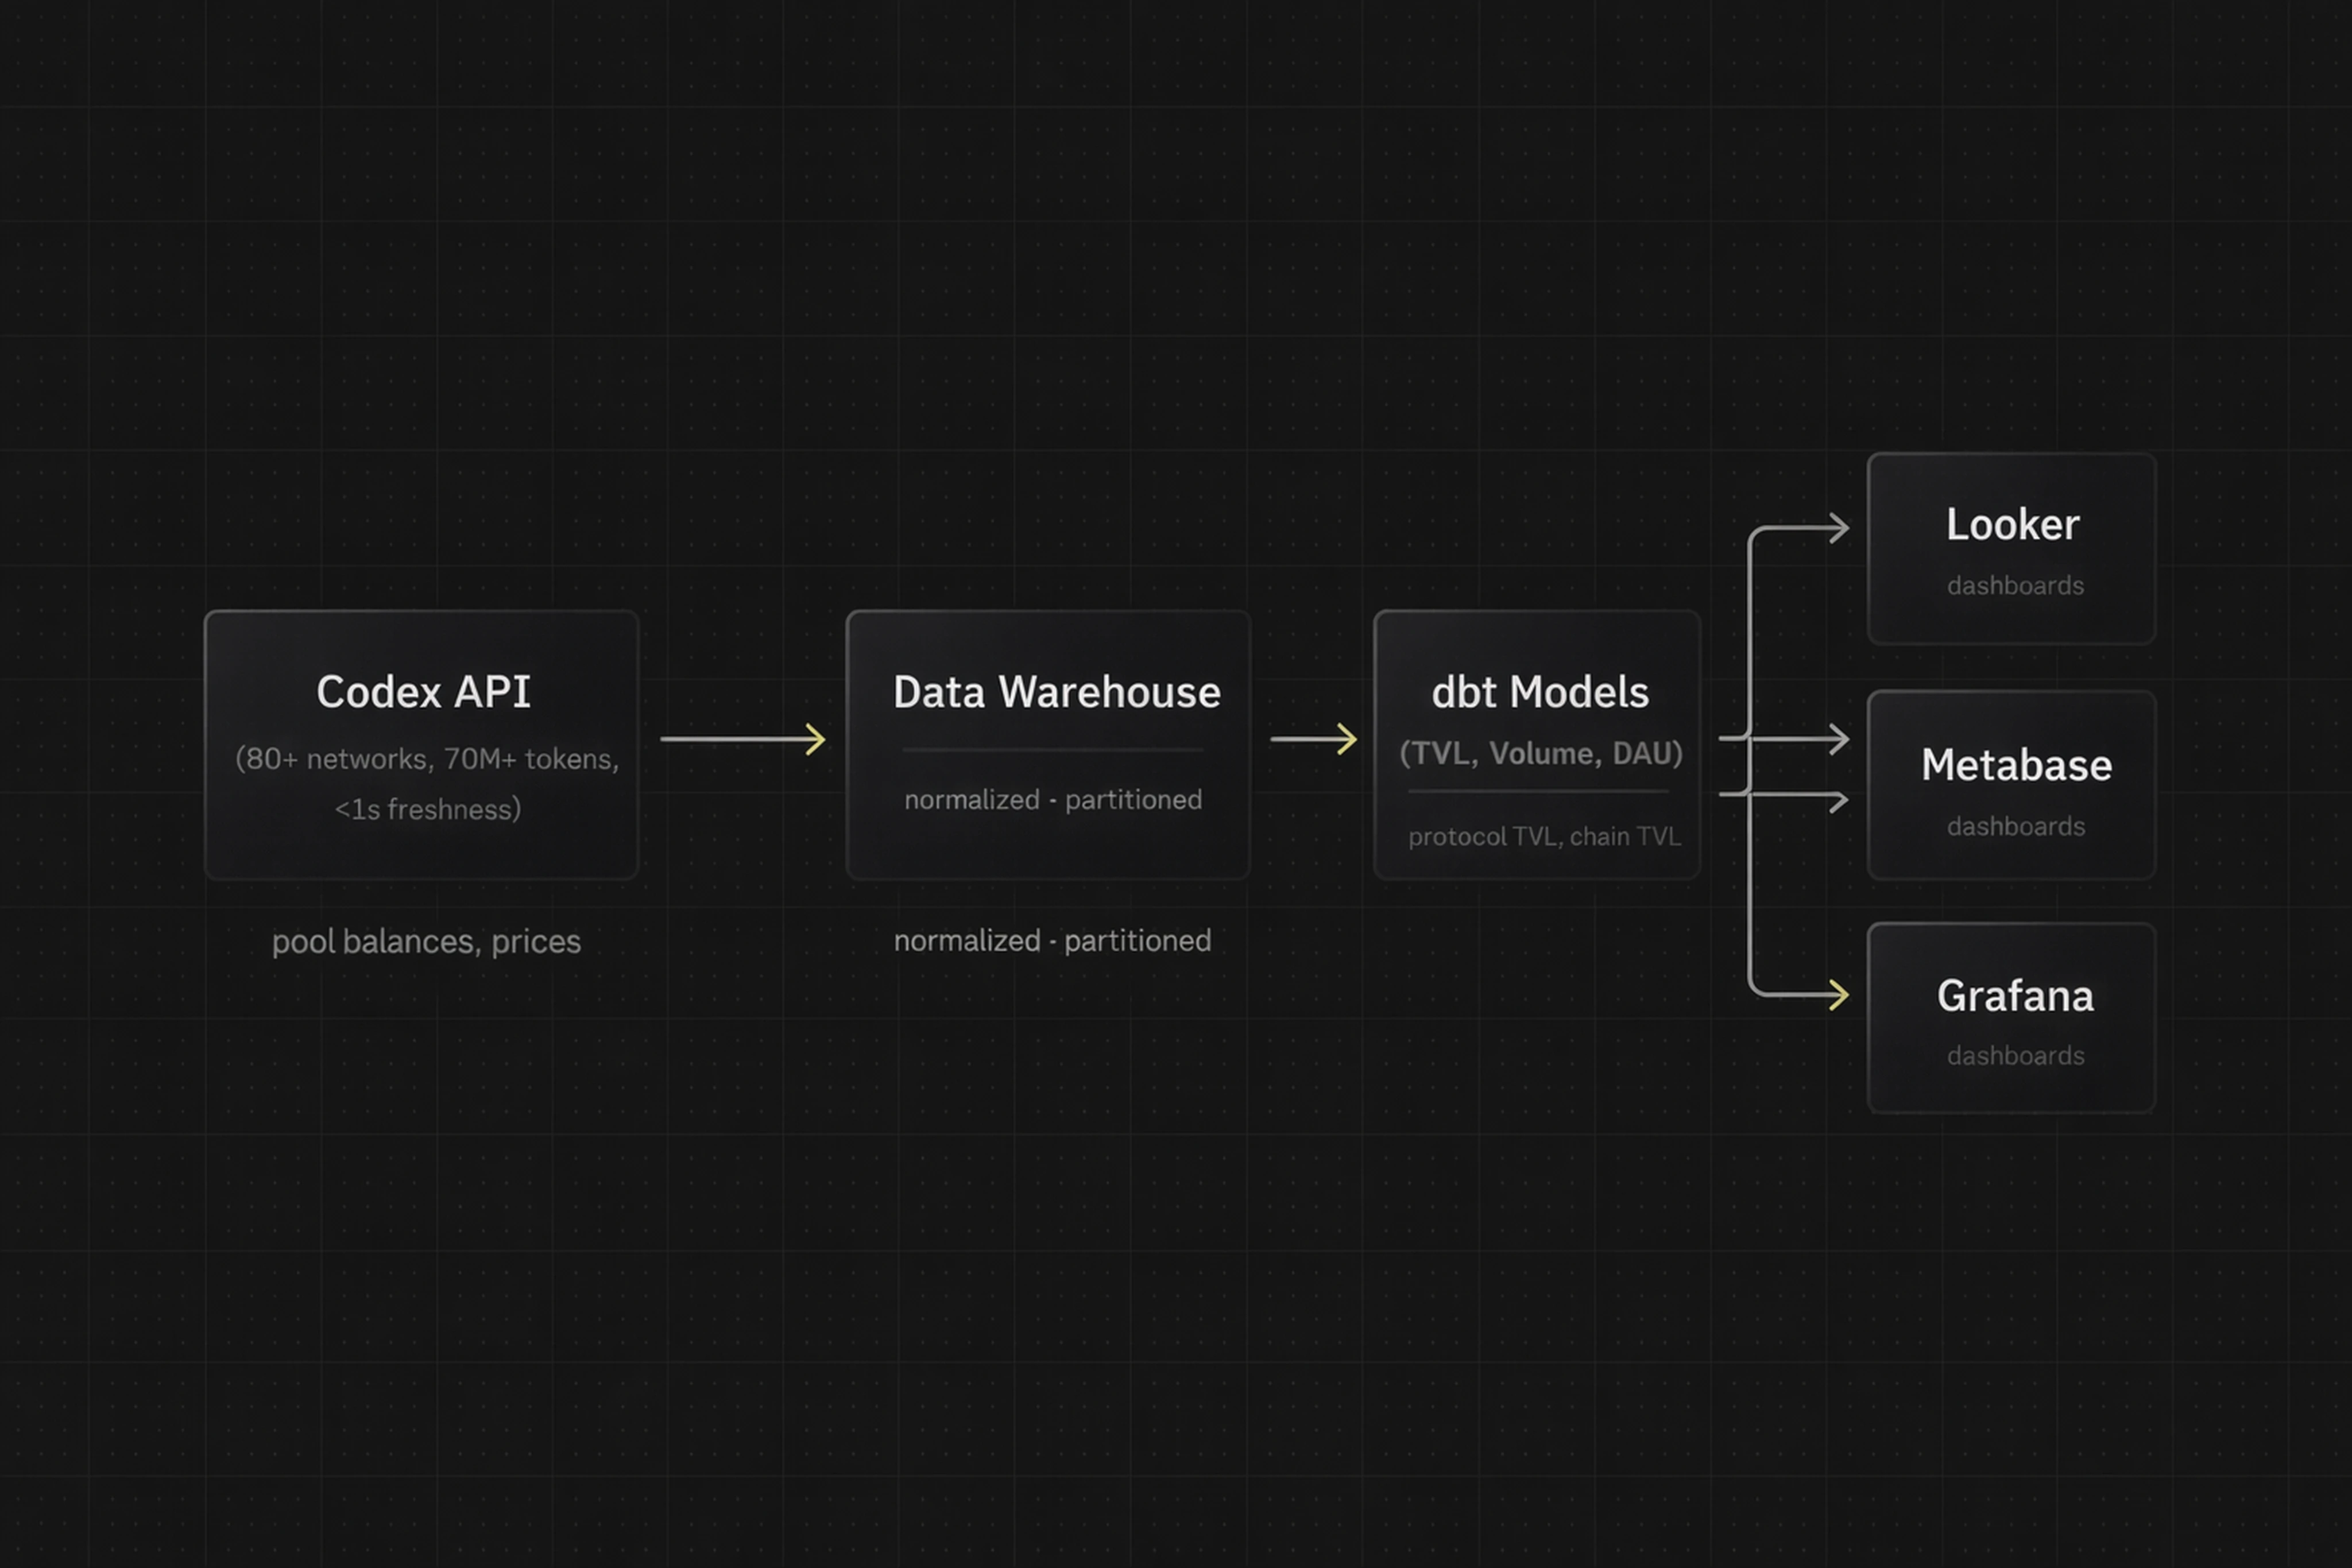
Using Codex and the schema above, you can compute TVL as:
- Fetch pool balances and prices via Codex.
- Sum the USD value per pool/protocol.
- Optionally, roll up by canonical asset.
Codex example: fetch token prices and liquidity
GraphQL example: get token prices (simplified):
query GetTokenPrices($tokenIds: [ID!]!) {
  getTokenPrices(tokenIds: $tokenIds) {
    tokenId
    chainId
    priceUsd
    priceNative
    lastUpdatedAt
  }
}
Sample JSON response:
{
  "data": {
    "getTokenPrices": [
      {
        "tokenId": "usdc.ethereum",
        "chainId": "ethereum",
        "priceUsd": 1.0002,
        "priceNative": 0.00027,
        "lastUpdatedAt": "2026-07-30T12:00:00Z"
      }
    ]
  }
}
GraphQL example: get pool/pair stats (based on Codex pair/liquidity endpoints[^codex-docs-core]):
query GetPairStats($pairId: ID!) {
  getPairStats(pairId: $pairId) {
    pairId
    chainId
    token0Id
    token1Id
    reserve0
    reserve1
    reserveUsd
    volume24hUsd
    liquidityUsd
    updatedAt
  }
}
You’d load this into fact_token_liquidity and dim_token.
TVL SQL example
Here’s an example TVL calculation SQL for a protocol:
WITH latest_liquidity AS (
  SELECT
    pool_id,
    token_id,
    MAX(snapshot_at) AS snapshot_at
  FROM fact_token_liquidity
  GROUP BY pool_id, token_id
),

pool_balances AS (
  SELECT
    fl.pool_id,
    fl.token_id,
    fl.snapshot_at,
    fl.reserve_amount,
    fl.reserve_amount_usd,
    dt.canonical_token_id
  FROM fact_token_liquidity fl
  JOIN latest_liquidity ll
    ON fl.pool_id = ll.pool_id
   AND fl.token_id = ll.token_id
   AND fl.snapshot_at = ll.snapshot_at
  JOIN dim_token dt
    ON fl.token_id = dt.token_id
)

SELECT
  protocol_id,
  SUM(reserve_amount_usd) AS tvl_usd,
  CURRENT_DATE AS as_of_date
FROM pool_balances
JOIN dim_pool dp
  ON pool_balances.pool_id = dp.pool_id
GROUP BY protocol_id;
You can adapt this to:
- Compute TVL per chain (
GROUP BY chain_id) - Compute TVL per canonical asset (
GROUP BY canonical_token_id)
On-chain volume metrics for crypto exchanges and tokens
Different stakeholders want different on-chain volume metrics:
- Product: total swap volume by token and chain
- Quant: perp vs spot breakdown
- Growth: volume per user cohort
DefiLlama defines:
- DEX Volume: volume of all spot token swaps on a DEX
- Perp Volume: notional volume of trades, including leverage
- Token Volume: sum of value in all swaps to/from that token across CEXs/DEXs[^defi-defs]
SQL example: DEX spot volume from trade events
Assuming a fact_dex_trades table (built from Codex token events):
CREATE TABLE fact_dex_trades (
  trade_id           TEXT PRIMARY KEY,
  tx_hash            TEXT,
  block_timestamp    TIMESTAMPTZ,
  chain_id           TEXT,
  pool_id            TEXT,
  token_in_id        TEXT,
  token_out_id       TEXT,
  amount_in          NUMERIC,
  amount_out         NUMERIC,
  amount_in_usd      NUMERIC,
  amount_out_usd     NUMERIC
);
Compute daily DEX volume:
SELECT
  DATE(block_timestamp)             AS trade_date,
  chain_id,
  SUM(amount_in_usd)                AS dex_volume_usd
FROM fact_dex_trades
GROUP BY trade_date, chain_id
ORDER BY trade_date, chain_id;
To compute token-volume:
SELECT
  DATE(block_timestamp)             AS trade_date,
  t.canonical_token_id,
  SUM(COALESCE(amount_in_usd, 0) + COALESCE(amount_out_usd, 0)) AS token_volume_usd
FROM fact_dex_trades dt
JOIN dim_token t
  ON dt.token_in_id = t.token_id
   OR dt.token_out_id = t.token_id
GROUP BY trade_date, t.canonical_token_id
ORDER BY trade_date, t.canonical_token_id;
This aligns with DeFiLlama’s token volume definition and keeps cross-chain mapping consistent.
How to compute unique users: wallet deduplication and cluster IDs
Wallet counts are notoriously misleading because one entity can control many addresses. Chainalysis emphasizes that wallet clustering and attribution require heuristics and off-chain evidence, and are distinct from raw address counts.[^chainalysis-cluster]
Still, you can approximate entity-level metrics with a cluster_id:
- Each
wallet_idbelongs to acluster_id(entity). - Cluster IDs may come from:
- Internal address-linking logic
- Chainalysis / external labeling
- Heuristics (e.g., addresses that always transfer to each other)
SQL pattern: daily active wallets vs entities
-- Daily active wallets (address-level)
SELECT
  DATE(block_timestamp) AS activity_date,
  COUNT(DISTINCT from_wallet_id) + COUNT(DISTINCT to_wallet_id) AS daily_active_wallets
FROM fact_token_transfers
GROUP BY activity_date;

-- Daily active entities (cluster-level)
WITH active_wallets AS (
  SELECT
    DATE(block_timestamp) AS activity_date,
    from_wallet_id AS wallet_id
  FROM fact_token_transfers
  UNION
  SELECT
    DATE(block_timestamp) AS activity_date,
    to_wallet_id AS wallet_id
  FROM fact_token_transfers
)
SELECT
  aw.activity_date,
  COUNT(DISTINCT dw.cluster_id) AS daily_active_entities
FROM active_wallets aw
JOIN dim_wallet dw
  ON aw.wallet_id = dw.wallet_id
GROUP BY aw.activity_date;
This gives you both wallet-level and entity-level DAU metrics for dashboards.
Codex API integration with Looker, Metabase, Grafana
Codex is one of the best on-chain data APIs for analytics dashboards when combined with a warehouse and BI tools.
Integration pattern (generic)
- Ingest: Use a small ETL service (Airflow, Dagster, dbt Cloud, or custom) to call Codex GraphQL and land data into your warehouse (Snowflake, BigQuery, Redshift, Postgres).
- Model: Use dbt to build semantic tables (
fact_*,dim_*) and metrics. - Serve: Connect Looker, Metabase, or Grafana directly to the warehouse.
Example Codex GraphQL call via fetch (Node/TypeScript)
import fetch from 'node-fetch';

const CODEX_ENDPOINT = 'https://api.codex.io/graphql';
const CODEX_API_KEY = process.env.CODEX_API_KEY!;

const query = `
  query TokenOHLCV($tokenId: ID!, $interval: CandleInterval!, $from: DateTime!, $to: DateTime!) {
    getTokenOHLCV(
      tokenId: $tokenId,
      interval: $interval,
      from: $from,
      to: $to
    ) {
      openTime
      open
      high
      low
      close
      volume
    }
  }
`;

async function fetchOHLCV() {
  const res = await fetch(CODEX_ENDPOINT, {
    method: 'POST',
    headers: {
      'Content-Type': 'application/json',
      'Authorization': `Bearer ${CODEX_API_KEY}`
    },
    body: JSON.stringify({
      query,
      variables: {
        tokenId: 'usdc.ethereum',
        interval: 'ONE_HOUR',
        from: '2026-07-01T00:00:00Z',
        to: '2026-07-30T00:00:00Z'
      }
    })
  });

  const json = await res.json();
  console.log(JSON.stringify(json.data.getTokenOHLCV, null, 2));
}

fetchOHLCV();
You’d batch these into parquet/CSV files or write directly to a database.
Looker integration
In Looker, you define metrics in LookML and point models at your warehouse tables.
Example LookML snippet for fact_token_price_ohlcv:
view: token_price_ohlcv {
  sql_table_name: fact_token_price_ohlcv ;;

  dimension: token_id {
    primary_key: yes
    type: string
    sql: ${TABLE}.token_id ;;
  }

  dimension_group: interval_start {
    type: time
    timeframes: [date, week, month]
    sql: ${TABLE}.interval_start ;;
  }

  measure: avg_price_usd {
    type: average
    sql: ${close_price_usd} ;;
  }

  measure: volume_usd {
    type: sum
    sql: ${TABLE}.volume_usd ;;
  }
}
This lets business users drag-and-drop charts for average price and volume without writing SQL.
Codex + Metabase
Metabase encourages defining official metrics so teams don’t invent their own KPI logic.[^metabase-metrics]
Flow:
- Connect Metabase to your warehouse.
- In the Data Model, mark
fact_token_price_ohlcv.volume_usdas a metric (“Daily Volume USD”). - Save common filters (e.g.,
token_id,chain_id) as default dimensions.
Example Metabase SQL question for a token overview:
SELECT
  DATE(interval_start) AS day,
  AVG(close_price_usd) AS avg_price_usd,
  SUM(volume_usd)      AS volume_usd
FROM fact_token_price_ohlcv
WHERE token_id = {{token_id}}
  AND interval = '1d'
GROUP BY day
ORDER BY day;
Drag this into a dashboard with:
- TVL chart (from TVL SQL above)
- Price + volume chart
- Holder counts by day (
COUNT(DISTINCT holder_wallet_id)from a holders table)
Codex + Grafana
Grafana is ideal when you want near real-time dashboards.
Approach:
- Use Codex WebSockets to stream events/prices into a time-series database (e.g., TimescaleDB, InfluxDB) or into Prometheus via exporters.
- Point Grafana at that data source.
Example: you stream fact_token_price_ohlcv into a time-series, then build panels for:
- 1m/5m OHLC candles
- 24h volume
- Risk alerts (e.g., price drops >10% in 5 minutes)
prediction market API real-time data
Prediction markets (Polymarket, Kalshi) are now a real analytics category, with Kalshi reporting $21.0B+ total volume.[^kalshi-volume] Codex exposes prediction market data (events, markets, trades, trader stats) through a GraphQL API (currently beta).[^codex-pred]
For prediction market API real-time data, you can:
- Use Codex WebSockets for market updates
- Stream trades into
fact_prediction_trade - Build dashboards for event-level liquidity and trader behavior
Example GraphQL query: prediction events and markets
query PredictionEvents($platform: PredictionPlatform!) {
  filterPredictionEvents(platform: $platform, first: 10) {
    nodes {
      eventId
      title
      category
      startTime
      endTime
      status
      markets {
        marketId
        outcome
        status
      }
    }
  }
}
Sample response (simplified):
{
  "data": {
    "filterPredictionEvents": {
      "nodes": [
        {
          "eventId": "kalshi_event_123",
          "title": "Will BTC close above $70k on Dec 31?",
          "category": "Crypto",
          "startTime": "2026-06-01T00:00:00Z",
          "endTime": "2026-12-31T23:59:59Z",
          "status": "open",
          "markets": [
            {
              "marketId": "kalshi_market_123_yes",
              "outcome": "YES",
              "status": "open"
            }
          ]
        }
      ]
    }
  }
}
WebSocket subscription example
Codex supports WebSockets for subscriptions (see docs for exact syntax).[^codex-pricing] A typical pattern:
- Subscribe to
onPredictionTradesCreated. - Append trades into
fact_prediction_tradevia a streaming pipeline.
Pseudo-code (Node):
import WebSocket from 'ws';

const ws = new WebSocket('wss://api.codex.io/graphql', {
  headers: { Authorization: `Bearer ${process.env.CODEX_API_KEY}` }
});

const subscriptionQuery = `
  subscription OnPredictionTrades($marketId: ID!) {
    onPredictionTradesCreated(marketId: $marketId) {
      tradeId
      marketId
      traderWalletId
      executedAt
      price
      size
      notionalUsd
      side
    }
  }
`;

ws.on('open', () => {
  ws.send(JSON.stringify({
    type: 'start',
    payload: {
      query: subscriptionQuery,
      variables: { marketId: 'kalshi_market_123_yes' }
    }
  }));
});

ws.on('message', msg => {
  const data = JSON.parse(msg.toString());
  // write data.payload.data.onPredictionTradesCreated to your warehouse
});
With this, you can build:
- Live order-book style dashboards for prediction markets
- Event-level liquidity charts
- Trader PnL and cohort performance panels
Putting it together: dashboards for product, risk, and growth
Once Codex data is modeled, you can build targeted dashboards.
Product dashboards
Questions:
- Which tokens drive the most volume and revenue?
- How do price and liquidity affect user engagement?
Components:
- Token-level volume & price panels
- User DAUs (wallets & entities)
- Chain-level TVL trends
Risk dashboards (e.g., DeFi liquidation monitoring)
Questions:
- Where is protocol TVL concentrated?
- Which pools are most exposed to volatile assets?
- Which addresses look like wash traders or risky counterparties?
Components:
- TVL by asset and protocol
- Large transfer alerts (from
fact_token_transfers) - Address risk labels (via
dim_wallet.labelsand optional Chainalysis data)
Growth & GTM dashboards
Questions:
- Which geographies / clusters are growing?
- Which launchpads or prediction events drive new users?
Components:
- New wallets and entities by day
- Volume and TVL by region/segment
- Prediction market events with highest unique trader counts
FAQ: Building crypto analytics dashboards with Codex
1. Why use Codex instead of running my own indexers?
Running indexers, RPC nodes, and ETL pipelines across 80+ networks is a major engineering burden. Codex ingests raw chain data, normalizes it into trading‑ready objects (tokens, prices, trades, holders, prediction markets), and exposes it via a unified GraphQL API.[^codex-pricing][^codex-docs-core]
This saves months of engineering and reduces your infra surface area.
2. How does Codex compare to other on-chain data APIs for analytics dashboards?
Competitors like Dune, Bitquery, Covalent, Alchemy, and The Graph also provide multi-chain coverage.[^competitors] Codex differentiates by:
- Focusing on trading-grade token and prediction market data
- Emphasizing sub-second freshness and high throughput
- Providing an all-in-one API for prices, OHLC, holders, liquidity, and prediction markets
- Being battle-tested by large apps (Coinbase, TradingView, Uniswap)[^codex-home]
If you’re building charts, trading views, or token-aware dashboards, Codex is optimized for that use case.
3. How do I calculate TVL and volume consistently across tools?
Use Codex data as your single ingestion layer, then:
- Define TVL, volume, and DAU as dbt metrics or Looker/Metabase metrics.
- Point all BI tools (Looker, Metabase, Grafana) at the same warehouse and models.
dbt and semantic layer best practices recommend centralizing metrics so changes propagate automatically.[^dbt-semantic]
4. How do I handle new chains or tokens covered by Codex?
Because Codex uses a unified schema, new chains/tokens are automatically normalized. You:
- Add mappings for
chain_idandcanonical_token_idindim_token. - Re-run dbt models; metrics roll up automatically.
This is much simpler than adding new indexers per chain.
5. Can I start with the free Codex plan?
Yes. The public Free plan currently offers 10,000 requests/month and 5 req/sec, and the Growth plan starts at $350/month for 1M requests/month and 300 req/sec.[^codex-pricing]
Most teams start with a single dashboard or endpoint (e.g., token prices + OHLCV) and expand once data is validated.
If you want to accelerate your crypto analytics roadmap, Codex gives you the on-chain and prediction market data layer so you can focus on modeling, metrics, and UX — not on indexing chains.
[^codex-pricing]: Codex pricing and coverage stats (80+ networks, 70M+ tokens, 700M+ wallets, 27B+ events, <1s freshness, plan limits) from https://www.codex.io/pricing [^codex-home]: Reference customers (Coinbase, TradingView, Uniswap, Magic Eden, Rainbow, MoonPay) from https://www.codex.io [^codex-docs-core]: Codex docs for token prices, OHLCV, pair stats, holders, prediction markets from https://docs.codex.io/api-reference/queries/gettokenprices [^codex-pred]: Codex prediction market docs (Polymarket, Kalshi, beta status) from https://docs.codex.io/prediction-markets [^defi-defs]: TVL, DEX volume, token volume definitions from DeFiLlama at https://defillama.com/data-definitions and related docs [^dune-transfers]: Dune curated transfers (ERC-20 + native across chains) from https://docs.dune.com/data-catalog/curated/token-transfers/overview [^dbt-semantic]: dbt semantic layer and centralized metrics guidance from https://docs.getdbt.com/docs/use-dbt-semantic-layer/dbt-sl [^metabase-metrics]: Metabase metrics & data modeling guidance from https://www.metabase.com/docs/latest/data-modeling/metrics [^chainalysis-cluster]: Chainalysis wallet clustering and attribution overview from https://www.chainalysis.com/glossary/wallet-attribution/ [^competitors]: Multi-chain coverage claims from providers such as Dune, Bitquery, Covalent, Alchemy, The Graph, summarized in industry docs [^kalshi-volume]: Kalshi reported $21.0B+ total volume and market data at https://kalshi.com