Best On‑Chain Blockchain Data API Providers for Trading & Prediction Markets (Real‑Time, 2026)
Real‑time on‑chain data APIs and prediction market APIs data providers are now core infrastructure for trading apps, analytics dashboards, and NFT platforms.
This pillar guide maps the landscape from raw blockchain explorer APIs (like PolygonScan) to enriched analytics layers (like Codex), and shows how product teams can turn messy blockchain data into production‑ready metrics.
Last verified: August 31, 2026. All figures and claims are sourced from provider docs and public materials as of this date.
The Two Layers of Crypto On‑Chain APIs
1. Raw Chain Access (Nodes & Explorers)
Raw access focuses on:
- JSON‑RPC node APIs (e.g., Alchemy Chain APIs, QuickNode RPC, Nodit node services)
- Explorer APIs (e.g., PolygonScan, Etherscan families)
You typically get:
- Block, transaction, and log data
- Basic account balance queries
- Limited rate‑limited endpoints for developers
Examples:
- PolygonScan community API allows ~5 calls/second, 1,000 records per call, up to 100,000 calls/day, designed for inspection rather than high‑traffic apps (PolygonScan docs).
- QuickNode exposes RPC, REST, and gRPC endpoints over 80+ blockchains, plus Streams and Webhooks (QuickNode docs).
These are essential for low‑level access, but they don’t provide trading‑grade, normalized analytics out of the box.
2. Enriched Data Layers (Analytics‑Ready APIs)
Enriched APIs sit on top of nodes and explorers, index the chain, and expose structured data.
Providers include:
- Codex – trading‑grade token and prediction market data across 80+ networks, 70M+–76M+ tokens, and 700M+ wallets, plus 27B+ historical events and high‑throughput APIs (Codex site & pricing page, codex.io).
- Alchemy Data APIs – portfolios, token balances, transfers, prices, NFTs, simulations over 70+ chains (Alchemy docs).
- The Graph – subgraphs, Substreams, and a Token API for balances, transfers, holders, and DEX swaps across 60+ chains / 57 networks (The Graph docs).
- Bitquery – indexed data for 40+ blockchains, serving 40,000+ developers; streaming tiers from WebSocket (~1s) to Kafka (<500ms) and CoreCast (<100ms) (Bitquery docs).
- Moralis Data API – normalized token, NFT, and transaction data across 30+ chains (Moralis docs).
These APIs provide:
- Token prices and OHLCV chart data
- Aggregated volumes, liquidity, and unique wallets
- NFT metadata and rarity tools
- Prediction market markets, events, and trades
Provider Comparison — Coverage, Latency, Real‑Time Delivery
Below is a scannable matrix for key providers. Latency values are based on publicly stated benchmarks or tiers, not hard SLAs.
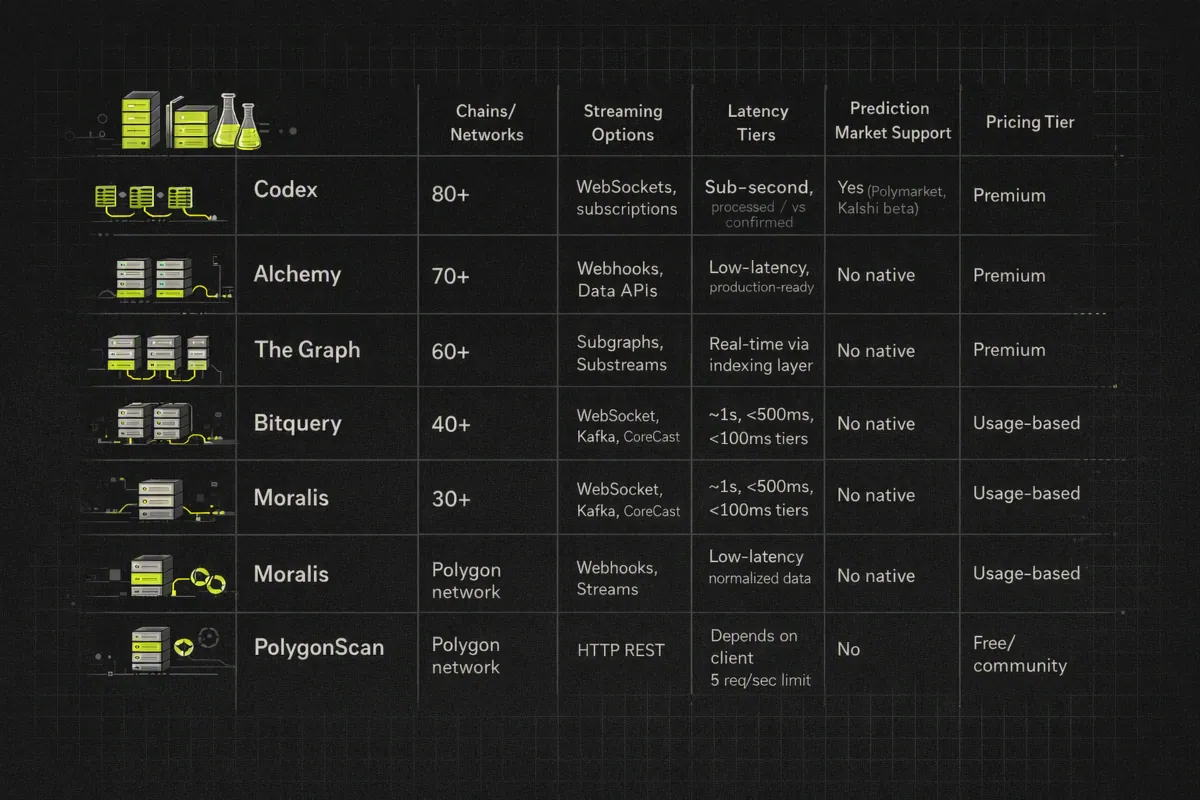
How to read this table
- Chains/Networks: Approximate count from provider docs.
- Latency tiers: Qualitative plus cited ranges where available.
- Streaming options: WebSockets, webhooks, streams, etc.
- Prediction markets: Whether native support is advertised.
- Pricing tier: High‑level positioning based on typical contracts.
Best On‑Chain Data Providers for Prediction Market Frontends
Prediction markets have matured into a distinct API category.
Why prediction market APIs matter
Frontends for platforms like Polymarket, Kalshi, and other venues need:
- Real‑time order and trade data for pricing and charts
- Event and market metadata (resolutions, outcomes, categories)
- Trader analytics (PnL, volume, positions)
Codex, Polymarket, Kalshi, and OpticOdds are examples of products exposing venue‑specific or aggregated prediction market data (Codex prediction markets docs; Kalshi institutional page).
Codex Prediction Market Platform: Features & Use Cases
Codex’s prediction market data layer is designed for trading‑grade performance:
- Markets and events:
filterPredictionEventsand related queries surface markets, resolutions, and outcomes (Codex docs).
- Trades and liquidity:
- Queries return trades, volume, and liquidity metrics per event and per market.
- Trader analytics:
- Endpoints expose trader‑level statistics (volume, positions, PnL) for building leaderboards and social trading features.
- Multi‑venue coverage:
- Codex integrates data from major prediction platforms including Polymarket and Kalshi (in beta) via one API surface (Codex docs).
Typical Codex prediction market use cases:
- Frontends for Polymarket‑style markets that need live odds and charts
- Quant dashboards comparing market prices versus traditional forecasts
- Retail trading apps where prediction markets sit alongside spot/futures
Real‑Time On‑Chain Data API & Latency for Trading Apps
Latency and data freshness are critical for trading interfaces, bots, and price‑sensitive consumer apps.
Latency tiers across providers
- Codex:
- Focuses on trading‑grade, sub‑second responses for token prices and charts; distinguishes processed vs. confirmed data.
- Chart recipes note that processed data prioritizes lowest latency for live trading UIs, while confirmed data is best for accuracy and historical analysis (Codex chart docs).
- Bitquery:
- Benchmarks streaming latency as:
- WebSocket: ~1 second
- Kafka: <500ms
- CoreCast: <100ms (Bitquery streaming docs).
- Benchmarks streaming latency as:
- QuickNode:
- DATA Network emphasizes exactly‑once delivery guarantees for Streams, designed for reliable event processing (QuickNode docs).
Push vs. polling
Industry‑wide, push‑based delivery is replacing polling for live apps:
- WebSockets & subscriptions:
- Used by Codex for real‑time charts and token stats (Codex docs).
- Webhooks:
- Common in Alchemy, QuickNode, Moralis at event boundaries.
- Streams / SSE:
- Bitquery, QuickNode, Nodit emphasize streaming for low‑latency applications (Nodit site).
For trading apps, the practical takeaway is:
- Use push for prices, trades, and chart updates.
- Use polling or bulk jobs for slower‑moving aggregates (e.g., daily stats).
From Polygon Block Explorer APIs to Production Dashboards
Explorer APIs like PolygonScan are perfect for inspection and prototyping.
PolygonScan API capabilities
PolygonScan (part of the Etherscan family) exposes endpoints for:
- Account balances
- Normal and internal transactions
- Contract logs and events
- Gas price & tracker data
Its free/community API limits are:
- 5 requests/second
- 1,000 records per call
- 100,000 calls/day
(Source: PolygonScan API docs).
Example PolygonScan API call
A typical REST request to list transactions for an address on Polygon might look like:
GET https://api.polygonscan.com/api
  ?module=account
  &action=txlist
  &address=0xYourAddressHere
  &startblock=0
  &endblock=99999999
  &sort=asc
  &apikey=YourApiKey
Simplified JSON response shape:
{
  "status": "1",
  "message": "OK",
  "result": [
    {
      "blockNumber": "12345678",
      "timeStamp": "1710000000",
      "hash": "0x...",
      "from": "0x...",
      "to": "0x...",
      "value": "1000000000000000000",
      "gas": "21000",
      "gasPrice": "30000000000"
    }
  ]
}
Key fields:
blockNumber— block heighttimeStamp— UNIX timestamphash— transaction identifierfrom,to— addressesvalue— amount in wei (requires conversion to MATIC)
Limits of explorer APIs for production apps
Explorer APIs are not ideal for:
- High‑traffic trading UIs needing hundreds of requests/sec
- Cross‑chain analytics or 30+ chain coverage
- Complex aggregates like unique wallets, liquidity, and OHLCV
That’s where enriched APIs like Codex, Alchemy Data, Moralis, and The Graph’s Token API come in.
NFT Rarity Tools & On‑Chain NFT Analytics
NFT analytics depend heavily on metadata quality and rarity calculation.
The rarity standardization problem
Two major sources highlight this issue:
OpenSea:
- Notes that differing rarity methodologies create confusion for buyers and sellers.
- Adopted OpenRarity to provide a transparent, reproducible rarity standard.
- Warns that rarity can change over time if creators update metadata. (OpenSea support).
Moralis:
- Calls NFT metadata "notoriously inconsistent" and emphasizes normalization to avoid per‑collection parsing logic.
- Says standardizing schemas, attributes, and naming makes indexing and UI rendering much easier. (Moralis NFT metadata docs).
Key NFT rarity and analytics tools
- OpenRarity:
- Open standard adopted by OpenSea for objective scarcity scores per NFT (OpenSea support).
- NFTGo GoRarity:
- Focuses on mathematical trait similarity and transparency for rarity ([NFTGo site, summary from research brief]).
- OpenSea NFT API:
- Has ingested 1.5B+ NFTs, supports 30M+ collections, and has processed $35B+ volume.
- API returns metadata, traits, ownership, and rarity for single NFTs (OpenSea API docs).
NFT market size context
DappRadar reports:
- 18.1M NFTs sold and $1.58B trading volume in Q3 2025.
- NFT market cap nearing $7B by July 2025.
(Source: DappRadar Q3 2025 report).
For product and engineering teams, this emphasizes why standardized, enriched NFT APIs are essential for wallets, marketplaces, and dashboards.
Turning Raw On‑Chain Data into Production‑Ready Metrics (Codex‑Style Enrichment)
Codex positions itself as an enriched, trading‑grade data layer so teams don’t have to build their own indexing and ETL.
Codex coverage and data scope
Publicly reported metrics (Codex site and docs, codex.io) include:
- 70M+–76M+ tokens across launchpads and long‑tail assets
- 80+ networks
- 700M+ wallets
- 27B+ historical events indexed
These figures may evolve; check the latest docs for current numbers.
Enrichment primitives: tokens, charts, stats, wallets
Codex ingests raw events (transfers, swaps, liquidity changes, etc.) and exposes structured objects.
Key capabilities:
Token discovery and stats:
- The
filterTokensquery uses 100+ on‑chain signals with rolling windows of 5m, 1h, 4h, 12h, and 24h to surface trending and new tokens. - Subscriptions expose metrics like buyers, sellers, traders, transactions, volume, liquidity, and more across those windows (Codex token docs).
- The
Trading‑ready charts:
- OHLCV candle data suitable for TradingView‑style UIs.
- Real‑time updates over WebSockets.
- Distinguishes processed vs. confirmed data, letting you choose latency vs. finality per use case (Codex charts recipe).
Wallets and balances:
- Cross‑chain views of holdings and activity across 700M+ wallets.
Scam filtering & metadata:
- Token metadata plus scam filtering to avoid showing junk or malicious assets in consumer interfaces (Codex marketing positioning, codex.io).
Example Codex GraphQL‑style query and response (pseudo)
Codex uses a GraphQL‑style API surface. A simplified query for token candles:
query GetTokenCandles {
  filterTokenBars(
    where: {
      tokenAddress: "0xTokenAddressHere",
      network: POLYGON,
      interval: FIVE_MIN
    }
    orderBy: [timestamp_ASC]
    limit: 100
  ) {
    items {
      timestamp
      open
      high
      low
      close
      volume
      liquidityUsd
    }
  }
}
Simplified pseudo‑response:
{
  "data": {
    "filterTokenBars": {
      "items": [
        {
          "timestamp": "2026-08-31T12:00:00Z",
          "open": 0.015,
          "high": 0.017,
          "low": 0.014,
          "close": 0.016,
          "volume": 125000.0,
          "liquidityUsd": 480000.0
        }
      ]
    }
  }
}
Common fields:
timestamp— normalized ISO timestampopen,high,low,close— OHLC pricesvolume— traded volume for the bar intervalliquidityUsd— snapshot of liquidity in USD for the token/pair
Compared to raw swap logs and pool events, this saves significant engineering work.
Why product teams offload enrichment
Codex, Alchemy Data, The Graph, Bitquery, Moralis and similar providers share a core belief: teams should not spend months building fragile ETL pipelines.
Benefits of using an enriched API layer:
- Faster shipping: Build trading UIs, wallets, and dashboards without writing custom parsers for every network.
- Lower infra risk: Avoid operating dozens of nodes, indexers, and databases across 30–80+ chains.
- Consistency: One schema and one source of truth for tokens, wallets, NFTs, and prediction markets.
Codex reinforces this by highlighting integrations with major apps such as Coinbase, TradingView, Uniswap, Magic Eden, Rainbow, MoonPay, Farcaster, and pump.fun in its marketing materials (codex.io).
Architecting Your On‑Chain Data Stack: Practical Patterns
For high‑traffic trading or prediction market apps, a common pattern emerges.
Pattern 1: Raw Nodes + Enriched Data API
Use node providers and explorer APIs for:
- Transaction submission and custom low‑level queries
- Fallback inspection and debugging
Use enriched APIs for:
- Prices, charts, token stats
- NFT rarity and metadata
- Prediction market events and trades
Pattern 2: Multi‑chain normalization
Leverage providers that standardize schemas across:
- EVM chains (Ethereum, Polygon, Arbitrum, etc.)
- Non‑EVM chains (e.g., Solana, Bitcoin when supported)
Moralis, Alchemy Data, Codex, and The Graph emphasize unified schemas over chain‑specific quirks (Moralis overview; The Graph about).
Pattern 3: Latency‑aware architecture
Match your data delivery to UX needs:
Sub‑second feeds for:
- Order books, price tiles, live charts, sniper bots
- Use WebSockets/Streams and processed data when acceptable.
Seconds‑to‑minutes latency for:
- Portfolio summaries, daily stats, tax dashboards
- Use confirmed data and batch jobs.
Bitquery’s tiered latency guidance (WebSocket ~1s, Kafka <500ms, CoreCast <100ms) is a useful mental model (Bitquery streaming docs).